Introduction
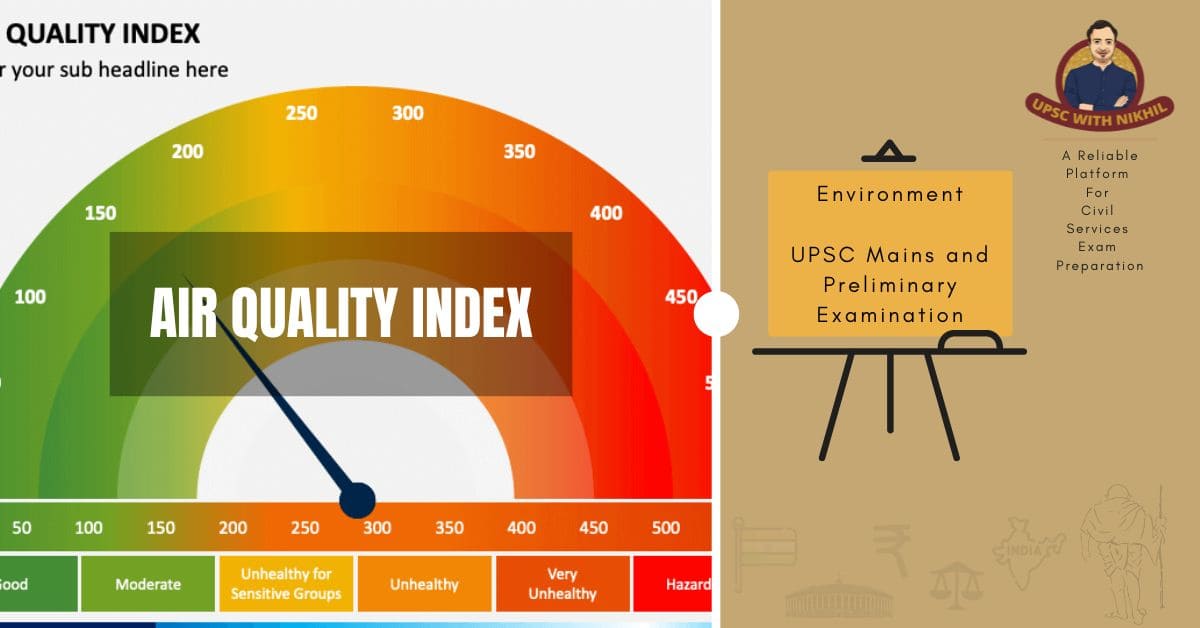
Air-quality index (AQI) is used by Government organizations to inform the public of how filthy the air is now or is expected to become. By averaging readings from an air quality sensor, which can rise owing to traffic, forest fires, or other factors that can increase air pollution, the air quality index (AQI) is determined. Ozone, nitrogen dioxide, and sulphur dioxide are only a few of the pollutants that are tested.
As the AQI rises, there are more dangers to the general public's health, particularly for young children, the elderly, and people who already have respiratory or cardiovascular conditions. Governmental organizations typically advise citizens to limit or even eliminate outdoor physical exercise during certain times. It may also be advised to wear a face mask, such as a fabric one.
According to various national air quality standards, various nations have their own air quality indices. Some of these include the Pollutant Standards Index (Singapore) the Air Pollution Index (Malaysia), and the Air Quality Health Index (Canada).
An Overview:
An air monitor's or a model's air pollutant concentration for a given averaging period is needed to calculate the AQI. When combined, concentration and time represent the air pollution dose. Epidemiological study determines the health effects associated with a specific dose. The function used to convert from air pollutant concentration to AQI differs by air pollutant due to differences in the potency of the pollutants. Values for the air quality index are often categorized into ranges. Each range has a typical public health advisory, a descriptor, and a color code.
An increase in air emissions may cause the AQI to rise. For instance, during rush hour traffic, when a forest fire is burning upwind, or when there is insufficient dispersion of air pollutants. High concentrations of pollutants, chemical interactions among air pollutants, and foggy conditions result from stagnant air, which is frequently brought on by an anticyclone, temperature inversion, or low wind speeds.
On a day when fine particle pollution is anticipated to cause the AQI to be elevated, an agency or public health group might:
1. Instruct vulnerable populations to refrain from outdoor activity, including the young, old, and those with respiratory or cardiovascular issues.
2. Declare an "action day" to promote voluntarily taking steps to cut air pollution, like using the bus or train.
3. Advise using masks to prevent breathing in small particles.
Agencies may use emergency plans to order major emitters (like coal-burning industries) to reduce emissions until the hazardous conditions pass during a period of extremely poor air quality, such as an air pollution episode, when the AQI indicates that acute exposure may cause significant harm to the public health.
The majority of air pollutants are not correlated with an AQI. Many nations construct air quality indices for the contaminants ground-level ozone, particulates, sulphur dioxide, carbon monoxide, and nitrogen dioxide.
The discussion around the creation of national air quality guidelines in a given country is reflected in the definition of the AQI in that country.
Recently, a website was made accessible that enables government organization’s from all over the world to contribute their real-time air monitoring data for display using a standard definition of the air quality index.
India:
The Swachh Bharat Abhiyan's National Air Quality Index (AQI) was introduced in New Delhi on September 17, 2014.
The National Air Monitoring Program (NAMP), which has more than 342 monitoring stations and covers 240 cities across the nation, is run by the Central Pollution Control Board in collaboration with the State Pollution Control Boards.
IIT Kanpur was given the task of conducting a technical research under the direction of an Expert Group made up of medical professionals, specialists on air quality, academics, advocacy organizations, and SPCBs. In 2014, the Expert Group and IIT Kanpur recommended an AQI programme. The new index measures eight parameters, as opposed to the prior measuring index's three indicators only. In New Delhi, Mumbai, Pune, Kolkata, and Ahmedabad, continuous monitoring systems that provide data on an almost real-time basis are implemented.
Good, Satisfactory, Moderate, Poor, Severe, and Hazardous are the six AQI classifications. Eight pollutants (PM10, PM2.5, NO2, SO2, CO, O3, NH3, and Pb) for which short-term (up to 24-hourly averaging period) National Ambient Air Quality Standards are specified will be taken into account by the proposed AQI. For each of these contaminants, a sub-index is calculated based on the measured ambient concentrations, related standards, and predicted health impact. The worst sub-index represents the AQI as a whole.
The group's medical specialists provided the key inputs for the recommended likely health effects for various AQI categories and contaminants. The AQI values for the eight contaminants detected, along with their related ambient concentrations (health breakpoints) and anticipated health effects, are as follows:
|
AQI Category, Pollutants and Health Breakpoints
|
|
AQI Category (Range)
|
PM10 (24hr)
|
PM2.5 (24hr)
|
NO2 (24hr)
|
O3 (8hr)
|
CO (8hr)
|
SO2 (24hr)
|
NH3 (24hr)
|
Pb (24hr)
|
Colour
|
|
Good (0–50)
|
0–50
|
0–30
|
0–40
|
0–50
|
0–1.0
|
0–40
|
0–200
|
0–0.5
|
Deep Green
|
|
Satisfactory (51–100)
|
51–100
|
31–60
|
41–80
|
51–100
|
1.1–2.0
|
41–80
|
201–400
|
0.5–1.0
|
Light Green
|
|
Moderate (101–200)
|
101–250
|
61–90
|
81–180
|
101–168
|
2.1–10
|
81–380
|
401–800
|
1.1–2.0
|
Yellow
|
|
Poor (201–300)
|
251–350
|
91–120
|
181–280
|
169–208
|
10–17
|
381–800
|
801–1200
|
2.1–3.0
|
Orange
|
|
Severe (301–400)
|
351–430
|
121–250
|
281–400
|
209–748
|
17–34
|
801–1600
|
1200–1800
|
3.1–3.5
|
Red
|
|
Hazardous (401-500)
|
430+
|
250+
|
400+
|
748+
|
34+
|
1600+
|
1800+
|
3.5+
|
Maroon
|
|
AQI
|
Associated Health Impacts
|
|
Good (0–50)
|
Minimal impact
|
|
Satisfactory (51–100)
|
May cause minor breathing discomfort to sensitive people.
|
|
Moderate (101–200)
|
May cause breathing discomfort to people with lung disease such as asthma, and discomfort to people with heart disease, children and older adults.
|
|
Poor (201–300)
|
May cause breathing discomfort to people on prolonged exposure, and discomfort to people with heart disease.
|
|
Very Poor (301–400)
|
May cause respiratory illness to the people on prolonged exposure. Effect may be more pronounced in people with lung and heart diseases.
|
|
Severe
(401-500)
|
May cause respiratory impact even on healthy people, and serious health impacts on people with lung/heart disease. The health impacts may be experienced even during light physical activity.
|